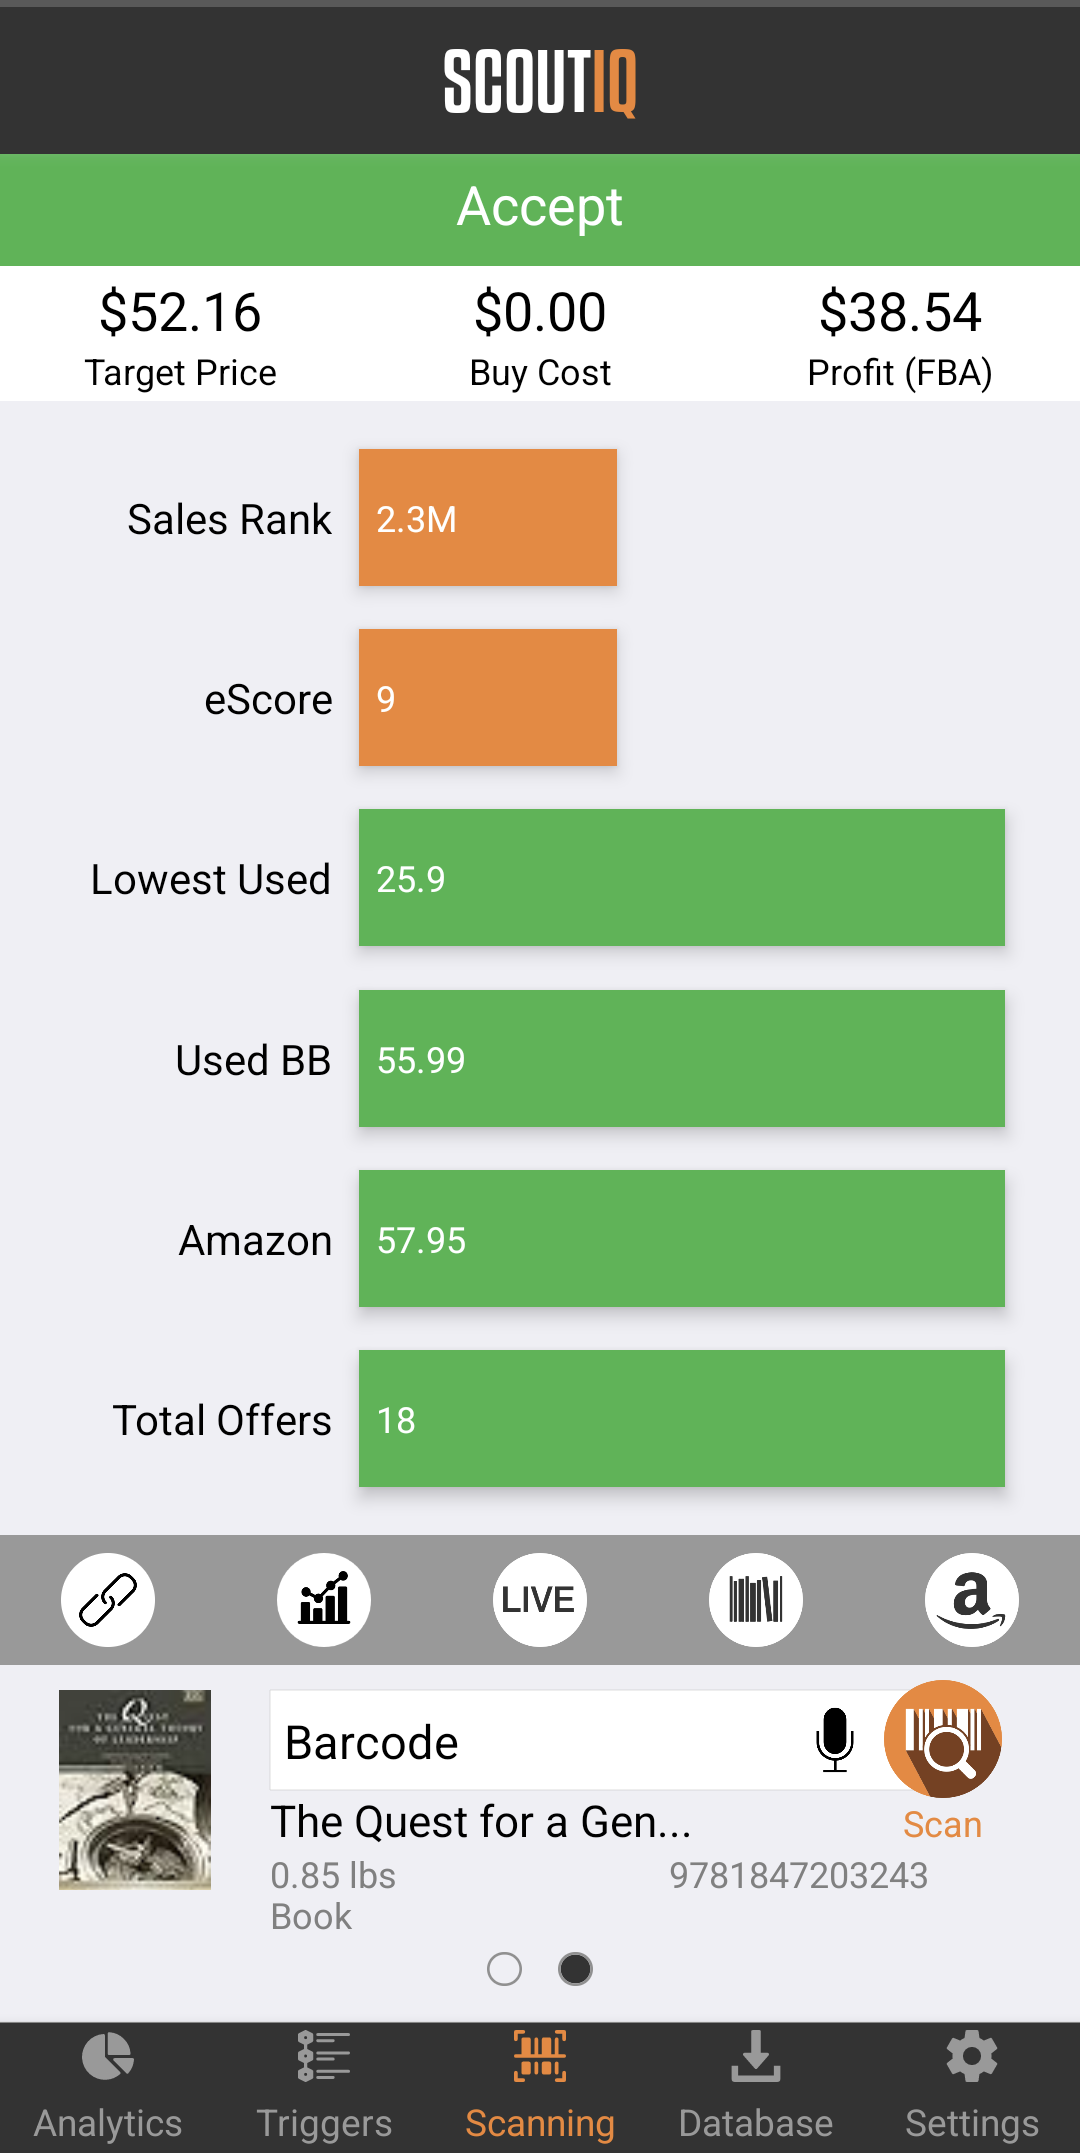
Having lots of data available at your fingertips with our Standard Scout Screen can be terrific or terrifying. Seeing so many numbers on the screen can overwhelm some people, especially those just starting out. To combat this "paralysis by analysis", we developed this Scout Lite screen:
The top portion of this screen still shows the same useful metrics found on the Standard Scout Screen, Target Price, Buy Cost, and Profit.
However, we have simplified the other information available on screen, but breaking them into three categories:
- Market demand - by showing the current Sales Rank and the book's eScore, you can easily determine if the book has a strong market demand and is likely to sell quickly, or if it's more of a long-tail book.
- Market pricing- sure, it's nice to see a dozen or so prices on the screen, but having the key prices easily visible can help you make faster decisions. We show you:
- The book's lowest used price (floor price),
- The Used Buy Box (usually the lowest Prime price),
- Amazon's price (ceiling price).
These are the primary prices you need to see to make an informed decision.
- Market supply- the last data point is the number of competing offers currently listed on Amazon. When there are hundreds of offers, there is likely to be lowball offers (both MF and FBA offers), and it can be harder to sell your book in a competitive environment. Fewer offers means less competition, and often higher FBA prices.
The bar's colors are correlated with how good or bad each data point is. Here's a breakdown of the target ranges for each metric:
The main idea is that if every bar turns green on the Scout Lite screen, it's likely a great book to purchase. If most data points are red or orange, you should pass on the book. When the bars contain a mixture of colors, you'll have to look closer at the data to make a quick decision. You can always swipe the screen to the left to bring up the Standard Scout Screen to see more detailed data. Some scouts prefer the simplified view, while others prefer a detailed view. No matter your preference, we've got your back!
Your triggers will still select the proper price for you based on your custom rules, and that Target Price and correlated Profit will show up on the top of the screen. If you want to see what would happen if you selected a different price, say the lowest used price, you can tap on the bar containing the price and it will reset your Target Price and Profit figures accordingly. If you tap on Amazon's price, it will set your Target Price to be the proper discount % from Amazon that you've set up in your triggers. This ensures you don't "fly too close to the sun" and compete with Amazon directly.
If there's no data for a particular metric, the bar will be minimal and turn gray so you can tell it doesn't exist.


